Project
Non-intrusive passenger sensing and AI-powered transit analytics
Objectives
Over 75% of EU citizens live in cities, and inefficient transport contributes to 24% of greenhouse gas emissions. Current ticketing and passenger counting systems do not provide continuous, detailed characterisation of passenger journeys (origin-destination) without intrusive hardware or compromising privacy.
inMotion tackles this by combining Wi-Fi and Bluetooth passive sensingwith machine learning to detect passenger movements. The goal: enable transport operators to optimise routes, right-size fleets, and make data-driven decisions — using infrastructure they already have.
System Architecture
PPS1 — Detection & Tracking
- Anonymous Wi-Fi and Bluetooth data capture at bus doors
- RSSI fingerprinting to infer movement patterns (board, alight, stay)
- Sensor fusion for multi-modal environments
- Studies on federated network viability (Eduroam, OpenRoaming) for seamless tracking without manual user association
PPS2 — AI Platform
- Neural networks and classical ML for route optimisation and demand prediction
- NLP interface using RAG (Retrieval-Augmented Generation) for operators to query data in natural language
- Origin-Destination matrix estimation from aggregated tracking events
Data Collection — RSSI Passenger Classification
Our first published study focused on classifying passenger movements using only Wi-Fi signal strength. Here's how we collected the data.
Experimental Setup
Two zones to simulate a bus and its door: Zone A (inside, a closed room with the access point at the doorway) and Zone B (outside, an adjacent corridor representing the bus stop). Four smartphone models from three brands (Samsung Galaxy S20, S23; POCO X7 Pro; Xiaomi Redmi 4) spanning Android 6 to 14.
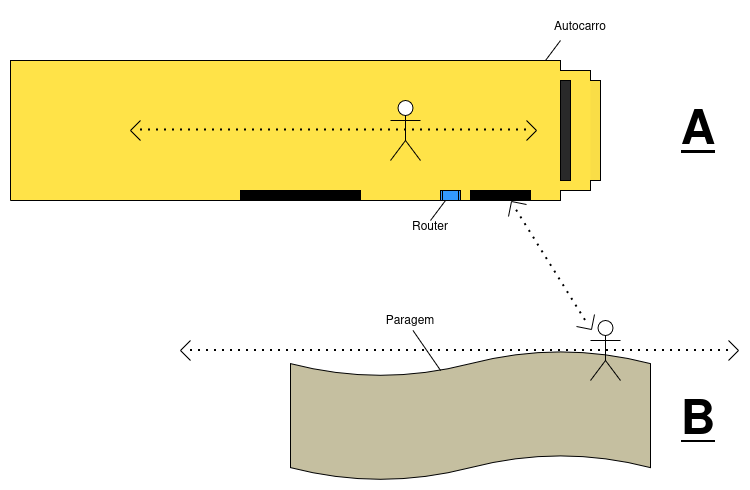
Movement Classes
Collection Protocol
- RSSI captured every second over 10-second windows → 10 values per sample
- Wired Ethernet from access point to laptop; Python script extracts live data
- Two conditions: isolated (1 device, 160 samples) and noisy (4 simultaneous devices, 1,196 samples)
- Scripted movements with known ground truth for labelling
Data Processing
- Raw captures: per-second Python dicts with MAC, RSSI, tx/rx bytes
- Per-device isolation by MAC address
- 10 RSSI readings transposed from rows to columns — each row = one 10-second trajectory
- Labels assigned: movement class (AA/BB/BA/AB) + noise flag
- Non-essential fields (bytes, connected time) discarded
The dataset is publicly available on IEEE Dataport (10.21227/55nm-0r91) and Zenodo. Code and processing scripts on GitHub.
Classification Pipeline
We evaluated 38 classifiers across six families: SVMs, ensemble methods (Random Forest, Extra Trees, CatBoost, XGBoost, LightGBM), Gaussian Processes, MLP neural networks, regularised logistic regression (L1/L2/ElasticNet), and stacking/voting ensembles.
- Bayesian hyperparameter optimisation with Optuna (50–1,300+ trials per classifier)
- Stratified 80/20 split, 5-fold CV, 3 random seeds for reproducibility
- Primary metric: Matthews Correlation Coefficient (MCC)
- Best results: KNN (MCC 0.907, isolated), CatBoost (MCC 0.770, noisy), Gaussian Process (MCC 0.756, combined)